Contact Home Simulator Tracker Training Overview
![]() Tracker monitors real time prices of a selected commerial node without tying
up the browser or Excel. Every five minutes it updates the real-time price
information automaticly. The Tracker can be used with only a ticker "tape"
showing even when the screen saver is running.
Tracker monitors real time prices of a selected commerial node without tying
up the browser or Excel. Every five minutes it updates the real-time price
information automaticly. The Tracker can be used with only a ticker "tape"
showing even when the screen saver is running.
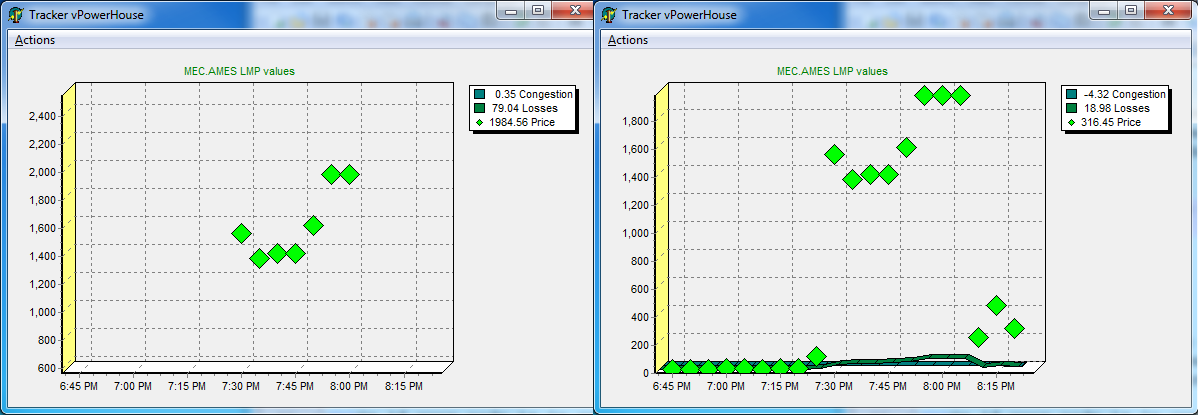
The 2 Hour RT chart plots a selected node's real time information. This chart is updated every five minutes. Allowing the operator to quickly compare the last price posted with the last posting. Tracker includes the DA price with the RT node information. enchanced Tracker scans all the nodes to get real-time price information not available on MISO's contour map or table.
Traces on Two hour RT Chart include the day ahead lmp price for convenience.
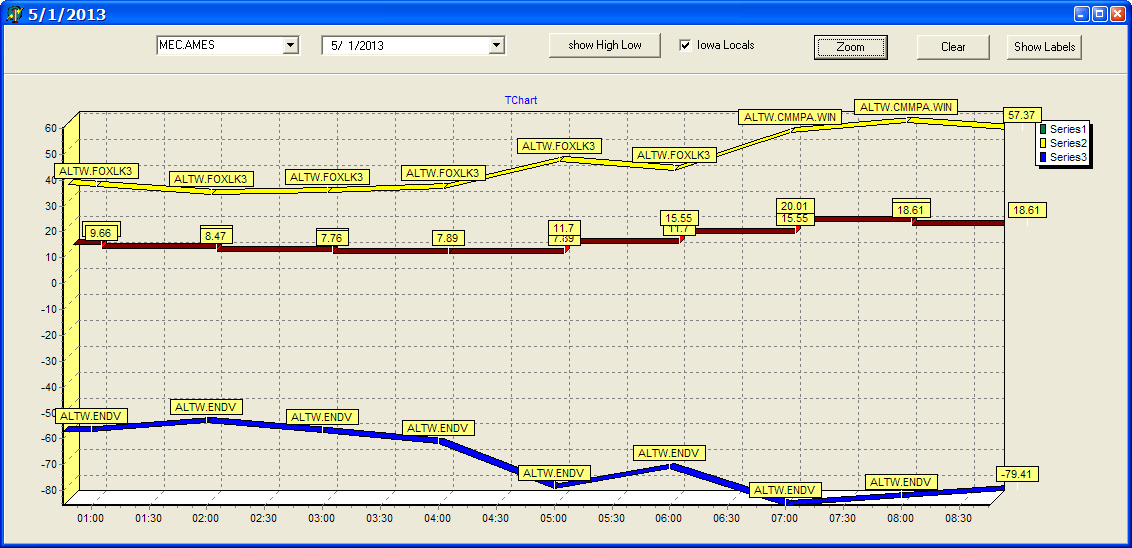
A DA Day chart rides under the five minute RT lmp chart. This chart shows the day's DA pricing for your node in relation to the local and the system high and low pricing. The color scheme for the DA day chart uses red for high system, yellow for high local, green for selected node, blue and voilet for low local and system traces respectively.
The latest selected lmp node price is displayed with MISO high and low price information. Local high and low prices are also displayed. These extra points greatly help in predicting the direction of future RT node pricing. Pro-action instead of reaction!

Tracker is a compiled executable. It doesn't need Java or VB runtimes. Scripts which may exploited or simply altered or corrupted to a not working state are not used with Tracker. This allows the Tracker to run without causing versioning issues with Java programs. Excel can use the csv files.

Or if your node is in consolidated node data set a standard model Tracker can get data from the contour map site
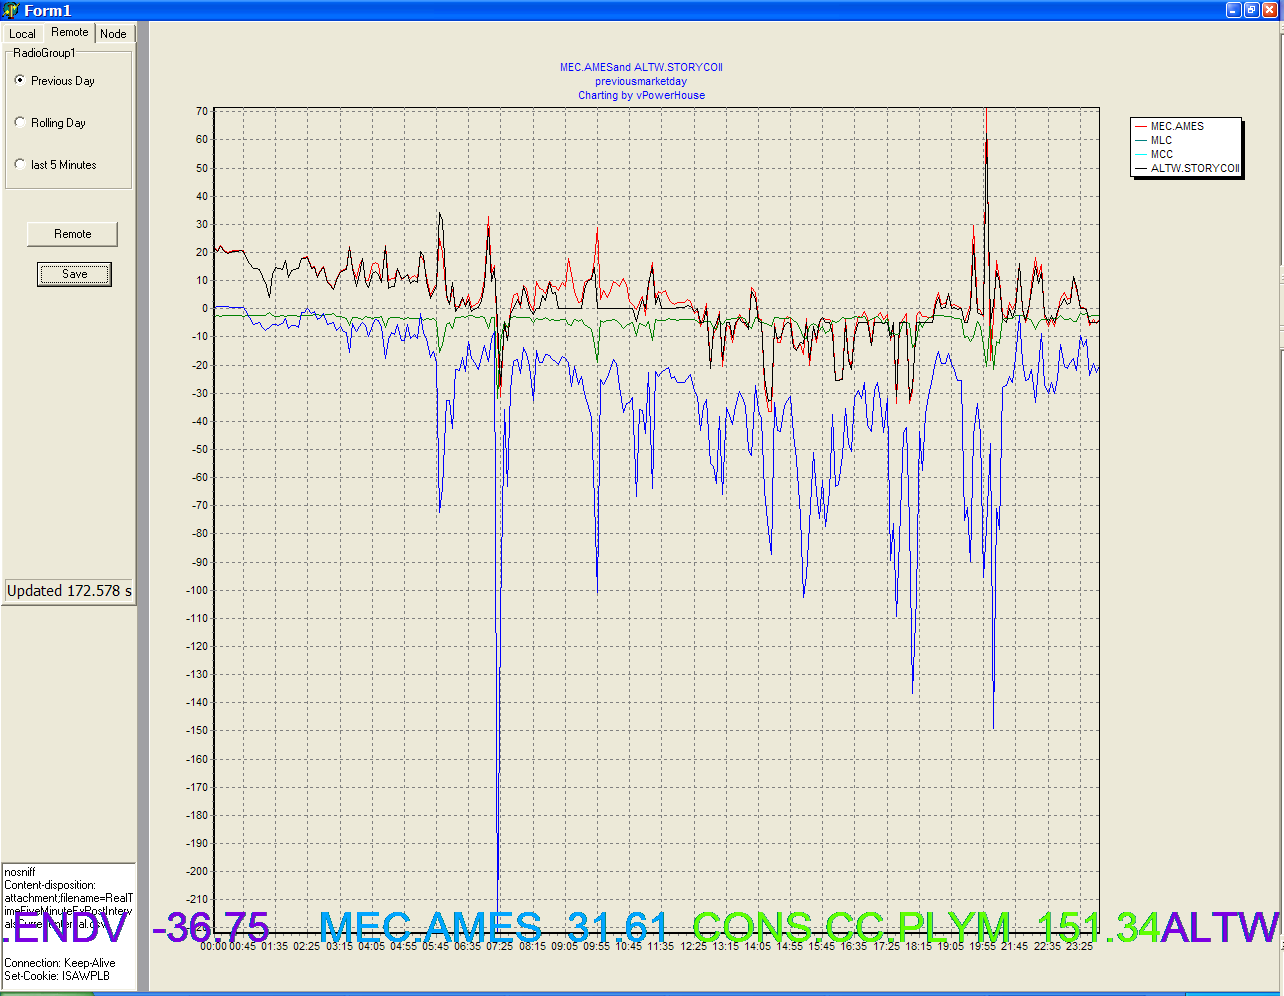
Loads the prior data for the day or the day before data. A fun thing to do is loading all the nodes to check the divergence of the MISO operating day prices.